5. Project Management
All Past Paper Questions: https://docs.google.com/document/d/1TIqAy1FT-xarYG0I5E4uOZ5TQ0qqKhIuBnwT46yZU9Y/edit?usp=sharing
Questions left out:
- p3-ch5-pg27
- p3-ch5-pg32
- p3-ch5-pg36
- p3-ch5-pg47
- p3-ch5-pg49
- p3-ch5-pg51
- p3-ch6-pg19
Terms
- dependencies
- reliying on one task upon another
- link between tasks
- can be
- resource based
- where eg: not enough space to carry both tasks
- logic based
- where eg: one task has to be carried before another
- resource based
- due to preferences of project manager
- for one task to be done before another
- eg: create logo before slogan
- deliverables
- a tangible (physical) outcome
- created as result of a project
- created from work during a project
- must be product agreed by stakeholders (both internal/external)
- must help to achieve objectives of the project
- tasks
- collection of activities
- produces an outcome
- definable component of a process
- must be completed in a set time frame
- related to single units of work
- related (within a project)
- defined by stated deliverables
PMS
-
project managment software
-
types
- new
- Desktop:
- for smaller projects
- Only one person can use the PMS at any one time
- Can be used on mobile devices
- lacks all the features of full software
- Collaborative:
- multiple uses to edit sections of the project
- Changes reflected to other users
- areas unavailable while others are working on them
- Visual:
- Allows information to be filtered and presented in easier to understand
- manner to avoid information overload
- Used for fluctuating data
- Details not instantly available.
- Desktop:
- old
- desktop PMS
- program runs on desktop
- for a single user
- web-based PMS
- runs on web-browser
- can use phone to access PMS
- use a thin client via a web browser
- personal PMS
- used at home
- to manage lifestyle and home projects
- single user programmed
- only one user will use it
- used at home
- collabarative PMS
- programmed to support multiple users
- web-based tools available
- desktop PMS
- new
-
software
- advantages
- tools can ease workflow
- can collaborate with team members
- each team member is kept upto date
- using communication tools
- in real time
- can easily share documents
- help manage risks
- to enable project to continue without interruption
- can create reports in different formats
- to keep people informed
- intuitive to use
- has dashboard-based interfaces
- simple to use and easy to install
- disadvantages
- expensive
- might outweight ROI (return of investment)
- not economic to use
- cant to specialized tasks
- project may be simple
- so, no need PMS software
- might unnessacarily complicate things
- automated alerts (may interrup workflow)
- expensive
- advantages
-
web based
- advantages
- data stored on server (about project)
- updates can be seen immediately
- easy collaboration (even remotely)
- dicussions & communications
- updates
- integrated mail servers (for quick notification)
- most web based pms
- are intercompatible
- user friendly
- no steep learning curve
- little training needed
- access control lists
- to control who is allowed
- to access data
- providing company does backups (easy + cheap)
- disadvantages
- may not have features like (reduced functionality)
- gnatt charts
- resource levelling
- need internet access
- might distract employees
- security issues
- when transmissiting over internet
- company data stored at third party service
- often not compatible with local/offline PMS tools
- most have a monthly subscription model
- costly over long term
- may not have features like (reduced functionality)
- advantages
-
how to use
- WBS technique to divide project into activities
- Use of arrow diagrams showing connected activities
- represent interdependencies of activities
- represent order of activities
- Show start date of activity
- Show end date of activity
- Use PERT
- Use estimates of time taken for activities
- (to identify critical path)
- Use of critical path
- to set out monitor
- show progress
- Use of critical path
- to calculate 'floats'
- Show longest time could be taken
- Allow resource allocation (efficiently)
- Allow to calculate costs
- Gantt charts can be used to show activities
- (different colours for activities)
-
cost
- costs from
- human labor
- pruchasing resources
- required software
- contingency costs to cover unexpected activities
- insurance (required to cover up failiures)
- cost estimation (using PMS)
- compare estimation with a similar project
- estimate using statistical + historical data
- parametric estimation
- average costs of several estimates
- 'three-point' estimating
- calculate cost of every activity in detail and calculate total
- bottom up estimation
- using PERT estimates by calculation (learn more here)
- most likely cost estimate
- when project has no difficulties
- worst possible cost estimate
- all tasks succeeding better than expected
- PERT 'three-point' estimating to eliminate bias
- provides estimate time taken for each task
- allowing costs to be calculated
- most likely cost estimate
- cost management (using PMS)
- records all transactions
- shows direct costs
- eg: cost of IT staff / team members
- shows indirect costs
- eg: rent / cooling costs / maintainance of equipment
- import data from financial packages/spreadsheets
- automatically calculates expenses
- used by managers to calculate budget
- can export data to graphs (during meetings)
- link costs to be easily available
- for decision makers to decide
- costs from
-
resource allocation
- Use of critical path analysis
- to show tasks that require resources.
- identify the time required
- to identify priority of tasks
- Use of resource levelling (resolving resource conflicts)
- to allocate resources/deliverable task identification
- to allocate identify demand for resources
- Create PRAM (Project Resource Allocation Matrix)
- to show the allocation resources
- against tasks.
- Use of Gantt charts
- to identify resource requirements.
- Use of collaborative calendars
- to deploy staff.
- SWOT analysis
- (Strength, Weakness, Opportunities, Threats)
- to identify where to deploy resources.
- Use of critical path analysis
-
schedule
- tools
- allows planning and executing a project
- from inception
- to completion
- provide tracking of workers
- shows if anyone is missing deadlines
- interchange tasks
- Allows flexibility to cope with
- e.g. unforeseen problems
- Can deliver resources at appropriate times
- can make simple projects more complex
- than they need to be
- tools expensive (for small projects).
- allows planning and executing a project
- tasks
- Define scope of project
- Create groups of activities
- e.g. conception/planning
- Create list of milestones
- Create list of sequence of activities
- Create start and finish dates
- Create lists of dependencies + milestones
- Carry out critical path analysis
- to discover shortest/longest time of project
- Allows regular updates of activities
- Create charts (Gannt/PERT) charts to show project schedule visually
- Use online calendars
- to organise meetings.
- how it can be used
- shows milestones
- has tools to put to milestones
- estimation of duration of activities
- tracking of team members
- automatic backups
- visual representation
- tools
-
decision making
- use options to choose (among alternative options)
- allows collaborative working
- use of graphics to represent choices
- use of IF-THEN logic to deal with 'partial choices'
- use mind mapping software to show decision trees
- exports data to other documents
-
for small projects
- not appropriate
- expensive
- may even cost more than the project
- can be complex to use
- may take too long to setup
- need too much training
- not worth the effort
Stuff 1
-
WBS (work breakdown structure)
- purpose
- hierarchial description
- of a project scope
- to show to shareholders
- describes
- all work required
- in all stages of development
- so everyone know what has to be done
- each layer
- describes what has to be done
- to reach the end stage
- hierarchial description
- characteristics (of well designed WBS)
- descriptions easily understandable
- work can be dividable to managable units
- to assign work to teams
- to assign to individuals
- can estimate duration of work
- work is measurable
- can calculate finishing time (estimate)
- work units
- done by each one seperately
- is put together
- to create the whole project
- adaptable to deal with changes to project scope
- purpose
-
PERT (performance evaluvation and review technique)
Paths
- critical path
- use
- reduces risk of delays
- as all are aware of project details
- allows resources to be available when required
- tasks can be scheduled in parallel
- shows dependencies of tasks
- so, can focus on critical ones
- to improve chance of project success
- use of 'floats'
- in timings
- can allow unexpected delays
- complex acitivies difficult to represent on a diagram
- + large diagrams are hard to understand
- external factors
- may change critical path analysis
- will have to re-make / redo
- pricing is estimates only, actual pricing may vary
- resource details are limited
- so other methods need to be used
- for charting
- what to draw in diagram (to calculate critical path) ?
- List of all the activities to finish
- A breakdown of
- resource allocation
- work schedules
- Duration of each activity
- Dependencies between activities
- End points of each activity
- and what can be completed
- at that point
- Measurable milestones
- Duration of project including float variables.
- outcomes that can be determined
- A visual representation of the whole project
- latest start dates for tasks
- Longest time that taken
- Expected end date
- Shortest possible time to complete
- ?? Any near/almost critical paths that may be possible altematives in project ??
- use
Charts
-
gnatt chart
- features
- timeline to show progress of each tasks
- timeline to show subtasks
- time-scale to represent time intervals for charts (in days/weeks)
- current date (shows today's date)
- milestones shown as check points
- gnatt bar shows task duration (a graphical representation)
- bars show planned start & end dates
- labels showing contingency (eg: slack time)
- colors representing eg: finished tasks
- annotations/lines representing critical path
- components
- timeline
- show duration (eg: in hours/days/weeks/months)
- milstone
- show finish date
- bars
- show full duration of tasks
- arrows
- show dependencies of tasks
- crtical paths
- show by arrows
- dateline
- shows current datetime
- timeline
- how to show overdue task
- use percentage bar with task bar
- use a red line on the chart
- use different colors of bars
- features
-
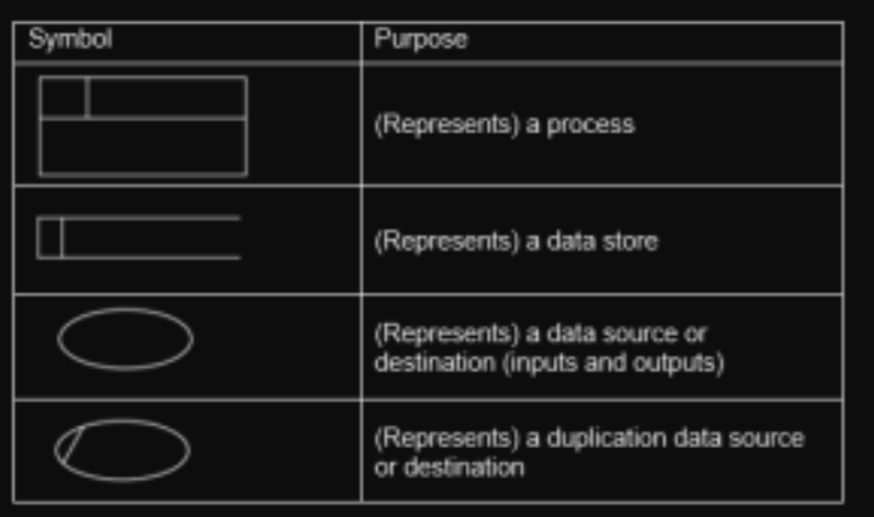
data flow diagrams (DFD)
- symbols
- purpose
- diagram to show how data flows
- from input through processes to storage
- give designers a visual representation
- makes it easier to understand
- documentation can be created
- physical components can be created (to make the system work)
- levels
- level 0
- only shows overview of system
- has only 1 process
- has no data storage
- simple to draw
- level 1
- shows more details of processors
- has more than one process
- shows data storage
- no technical knowledge required to draw
- level 0
- symbols